Observations
An observation is a normalized record of one event seen on a digital resource. Observations from every source land in the same Elasticsearch index (observations) with the same schema, so you can see — in one dashboard — what each part of your system is producing.
Create observations for a resource
- In the Flow Creator, hover a digital resource whose type Logstash can read (Kafka, Elasticsearch, HTTP, S3, Redis, RabbitMQ, Beats).
- Click Create observations.
- If more than one upstream processor or worker could be the origin of the events, choose it in Select observation source. The chosen asset is recorded on every observation and the pipeline is deployed for it.
- Save / Update the workflow.
WME adds:
- a shared digital resource WME Observations (Elasticsearch, index
observations, data kindObservation) — created once and reused; - a Logstash Pipeline processor named
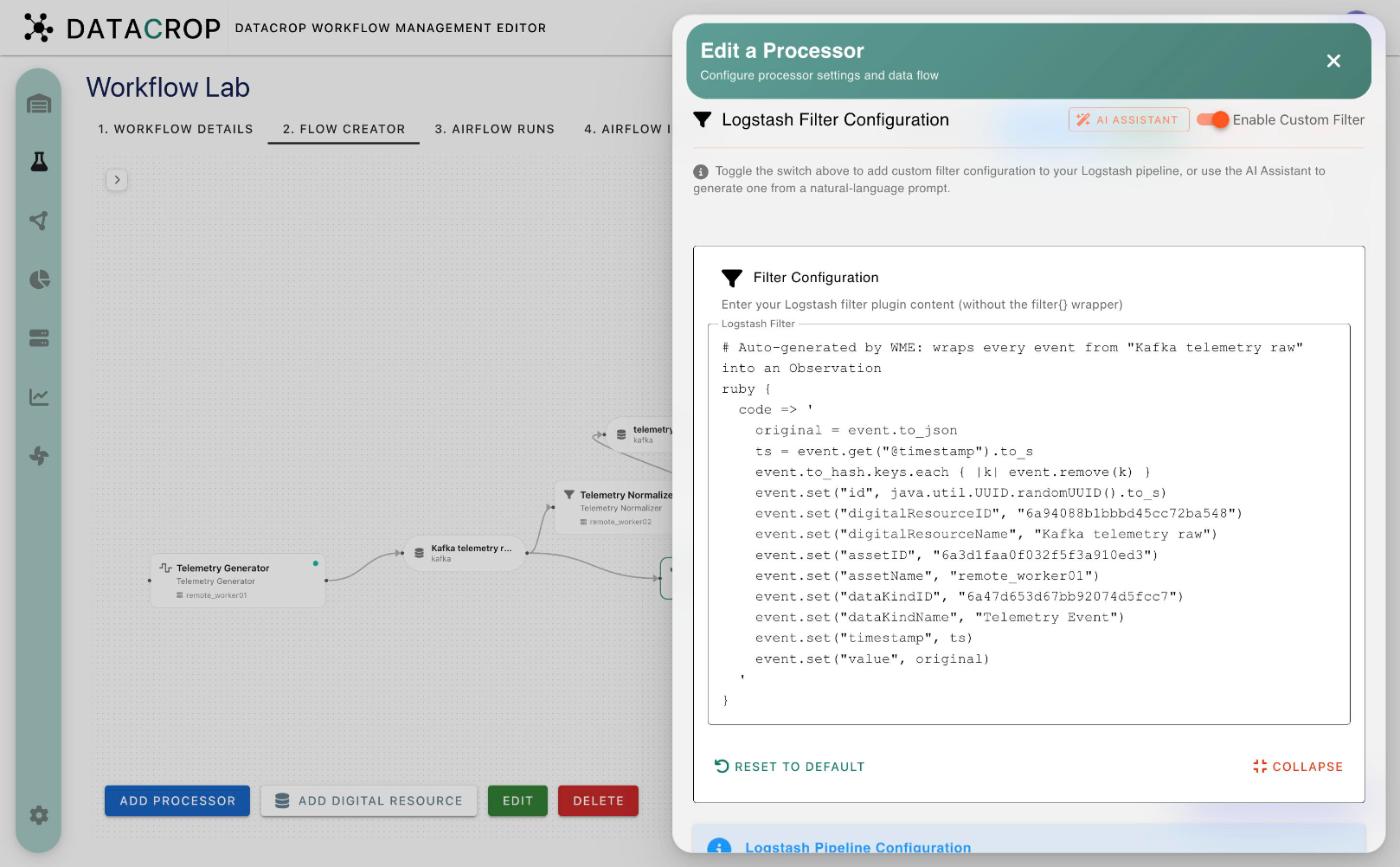
<resource> observations, reading the resource and writing to WME Observations, with a generated filter.
What an observation contains
The generated Ruby filter replaces each event with:
| Field | Value |
|---|---|
id | A new UUID |
digitalResourceID, digitalResourceName | The observed resource |
assetID, assetName | The selected source asset (worker or processor host) |
dataKindID, dataKindName | The resource's data kind |
timestamp | The event's Logstash @timestamp |
value | The original event, serialized as a JSON string |
Make fields searchable
value keeps the original event intact but as a string. If you want to chart a field of the original payload, extend the filter (for example with a json filter on a copy of the event) — the AI assistant can write it for you.
See them
- Logstash Monitor — the pipeline's event counters.
- Kibana Visualizations → WME Observations — the Observation dashboard: observations over time, per asset, per digital resource, per data kind, plus a saved search. See Kibana visualizations.