Kibana visualizations
Kibana Visualizations is a catalogue of your Elasticsearch digital resources with a shortcut into Kibana.
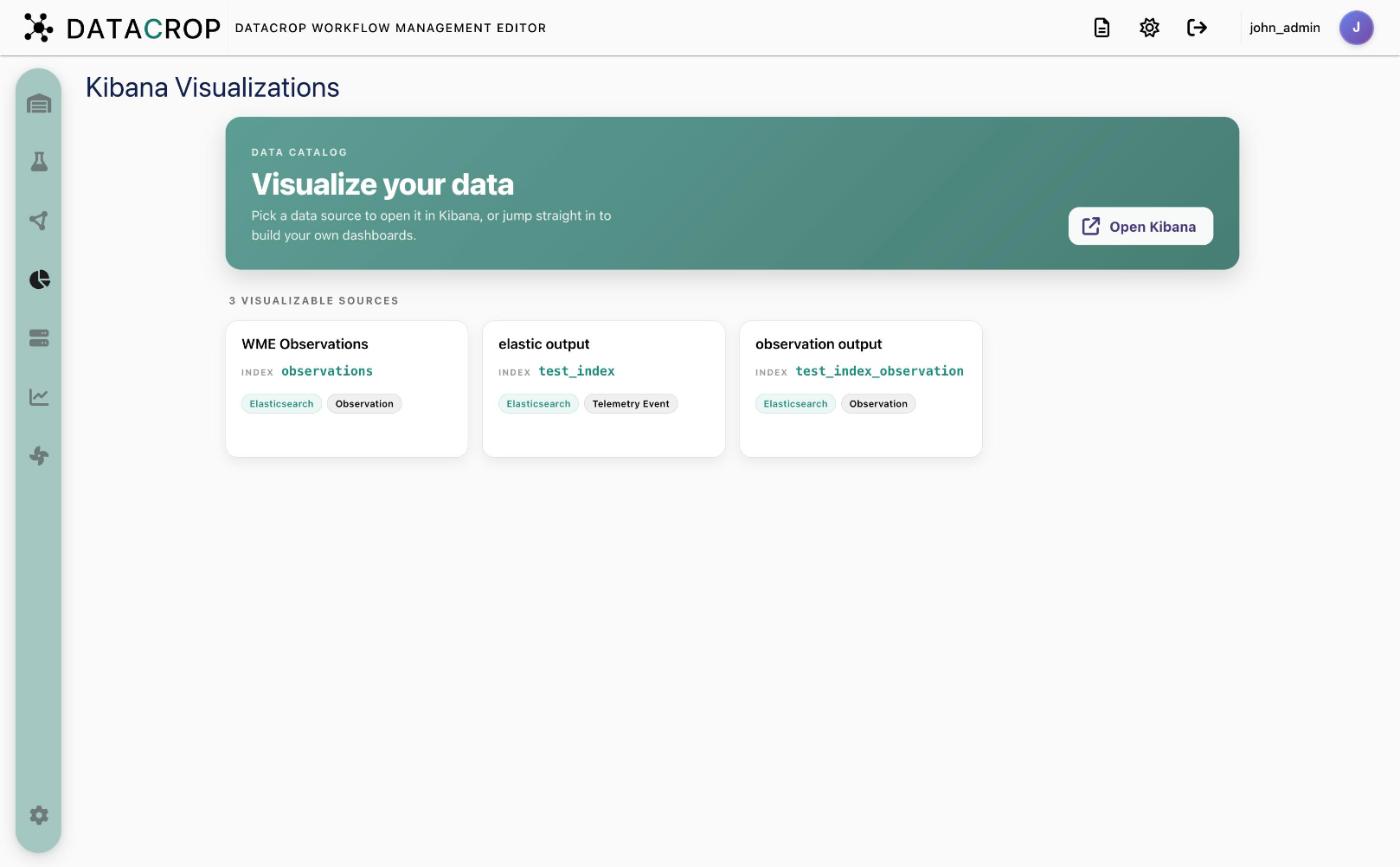
Open a source
Click a source card (or Open in Kibana on an Elasticsearch row in the Warehouse). WME then:
- makes sure a Kibana data view exists for the resource's index, choosing
timestamp(or@timestamp) as the time field; - builds a dashboard if needed:
- Observation dashboard for resources of data kind
Observation— Observations over time, per asset, per digital resource, per data kind, plus the saved search Explore observation records; - Timestamp overview for any other index with a time field — Documents over time;
- Observation dashboard for resources of data kind
- opens Kibana embedded in the page.
Use the view selector to switch between the dashboard, Discover records and Build dashboard. Back to data assets returns to the catalogue. The embedded view starts with a wide time range (the last five years) so historical data is visible.
Build your own
Open Kibana opens Kibana's dashboard editor. Dashboards you create there are ordinary Kibana objects; WME's generated dashboards are named WME Observation Dashboard – <index> and WME Timestamp Overview – <index>.
Kibana is embedded with anonymous access configured by the deployment. Restrict network access to Kibana accordingly — see Security model.