Walkthrough: observe your data
Processors exchange data through Kafka topics, Elasticsearch indices and other resources. Observations let you see that traffic: WME copies every event of a source into a common observations index, tagged with where it came from, and builds a Kibana dashboard on top of it.
1. Create observations
- Open the workflow from the previous walkthrough in the Workflow Lab → Flow Creator.
- Hover the
telemetry-rawresource. A Create observations button appears below it. Click it. - If several processors or workers could be the source of the events, WME asks you to Select observation source — the asset recorded on each observation.
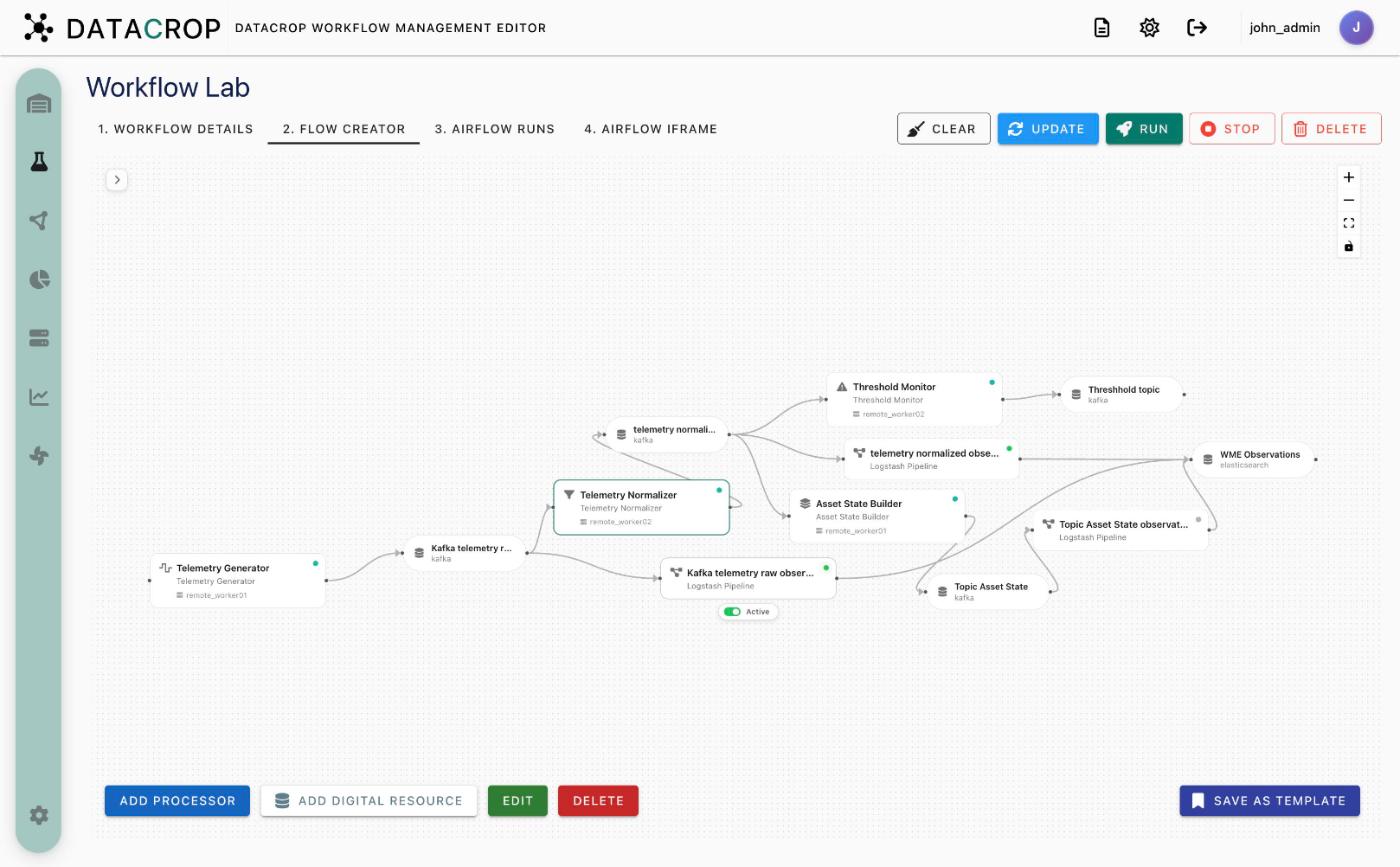
WME adds two nodes: a Logstash Pipeline processor named telemetry-raw observations and a shared WME Observations resource (Elasticsearch, index observations, data kind Observation).
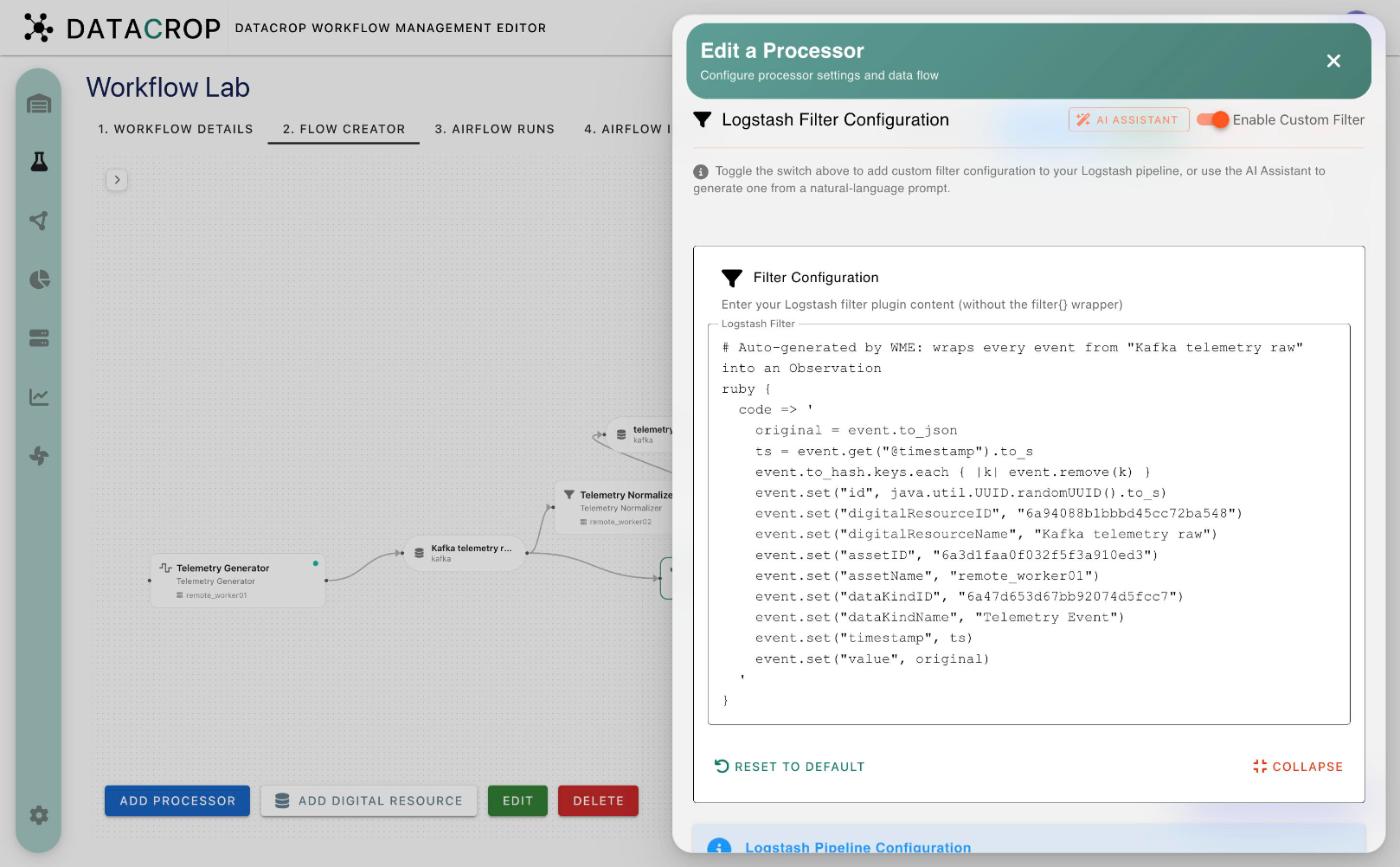
The generated filter keeps the original event as a JSON string in value and adds id, digitalResourceID/Name, assetID/Name, dataKindID/Name and timestamp.
2. Save
Click Update. Logstash pipelines do not go through Airflow: the backend regenerates the pipeline file and Logstash reloads within seconds. The pipeline node shows a green live indicator; hover it to pause or resume the pipeline.
3. Check the pipeline
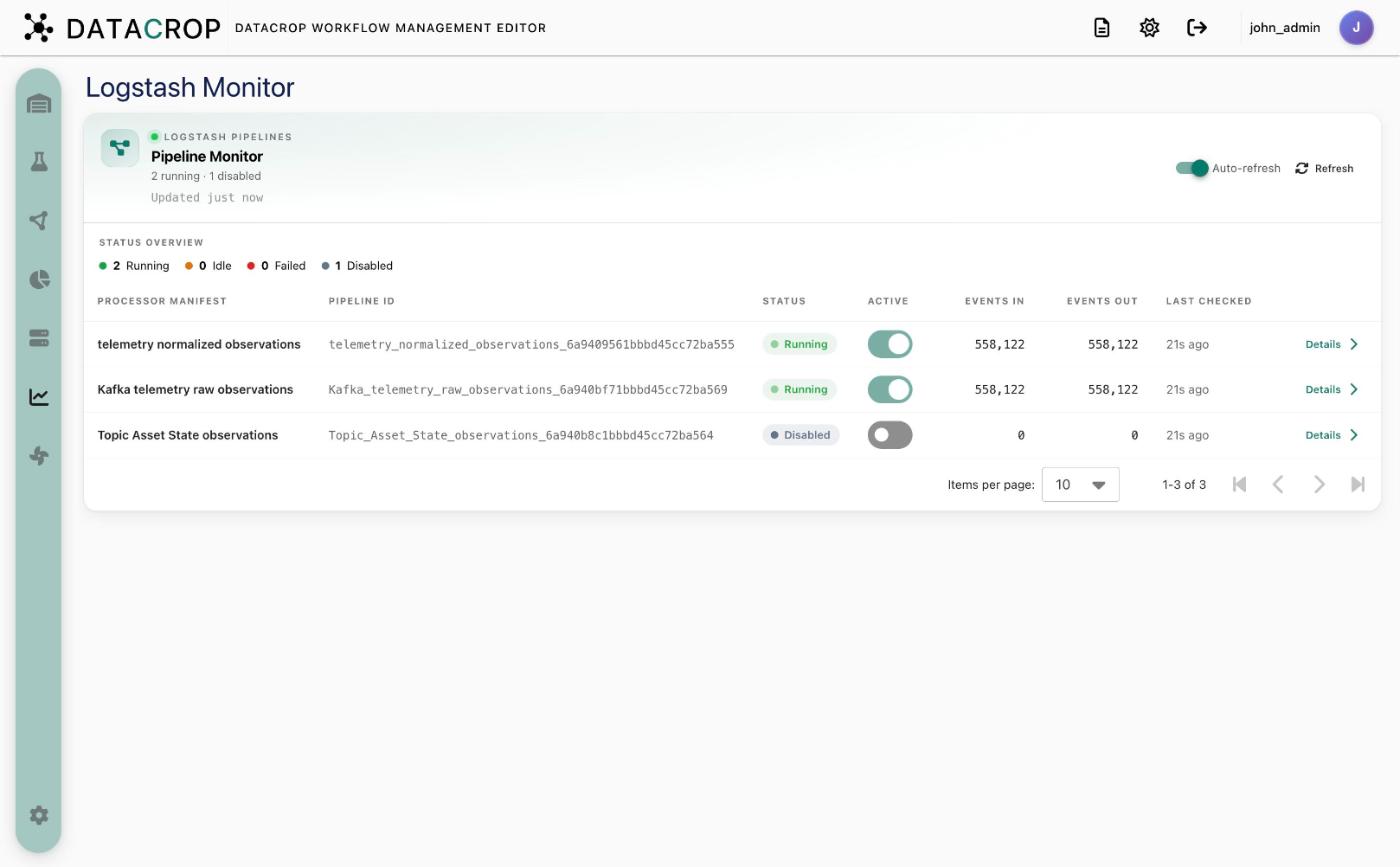
Open Logstash Monitor. The new pipeline should be Running, with Events In and Events Out increasing.
4. Explore in Kibana
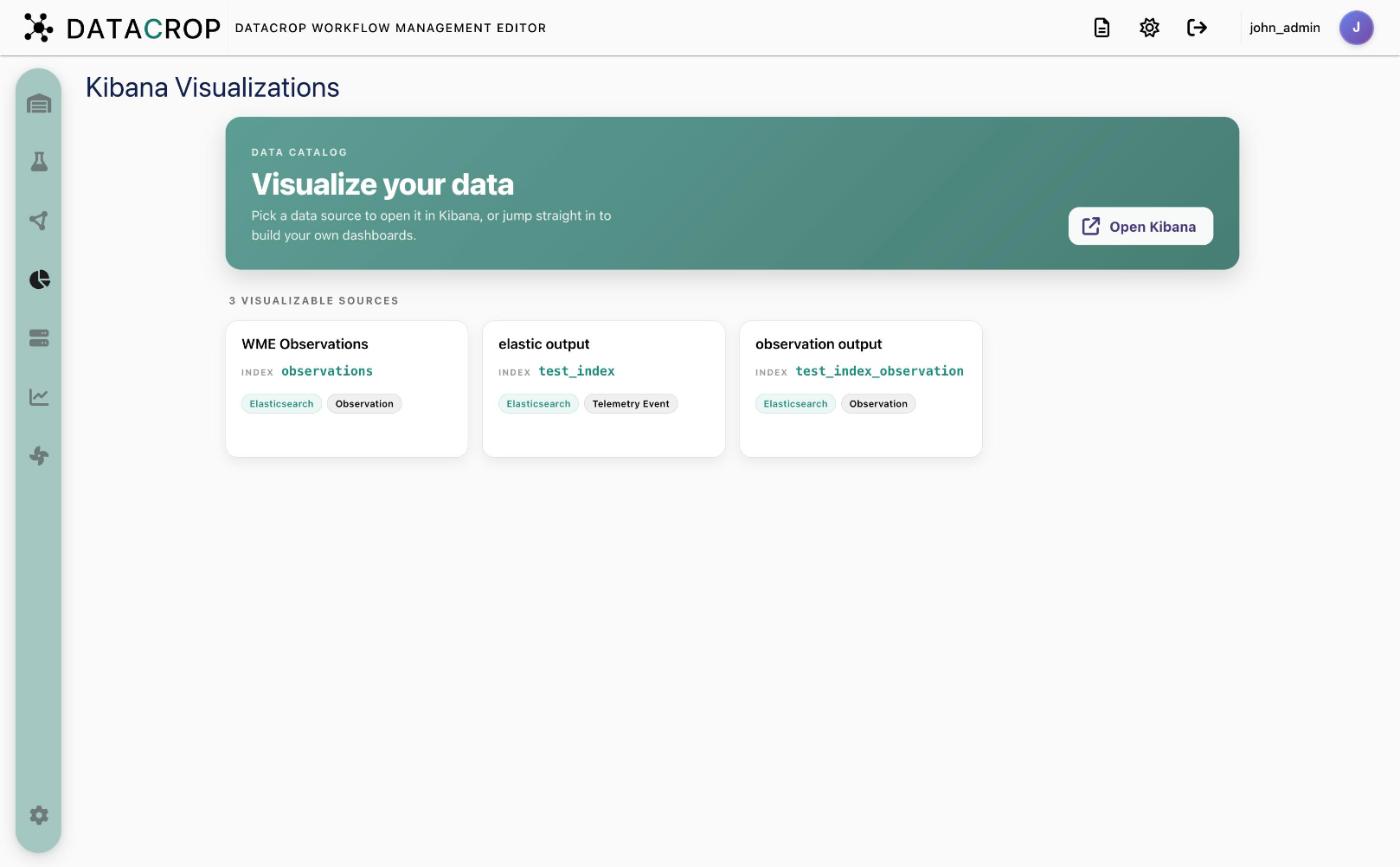
Open Kibana Visualizations. Every Elasticsearch resource you own is listed. Click WME Observations: WME creates the Kibana data view if needed and opens the Observation dashboard — observations over time, per asset, per digital resource and per data kind, plus a saved search of the raw records.
Use the view selector to switch to Discover records or Build dashboard. Any other Elasticsearch index with a time field gets a Timestamp overview dashboard instead.
Read more: Observations · Kibana visualizations.