Airflow And Operational Views
The editor includes several read-only operational pages for inspecting workflow execution, visualizations, and worker health without leaving WME.
Airflow DAGs
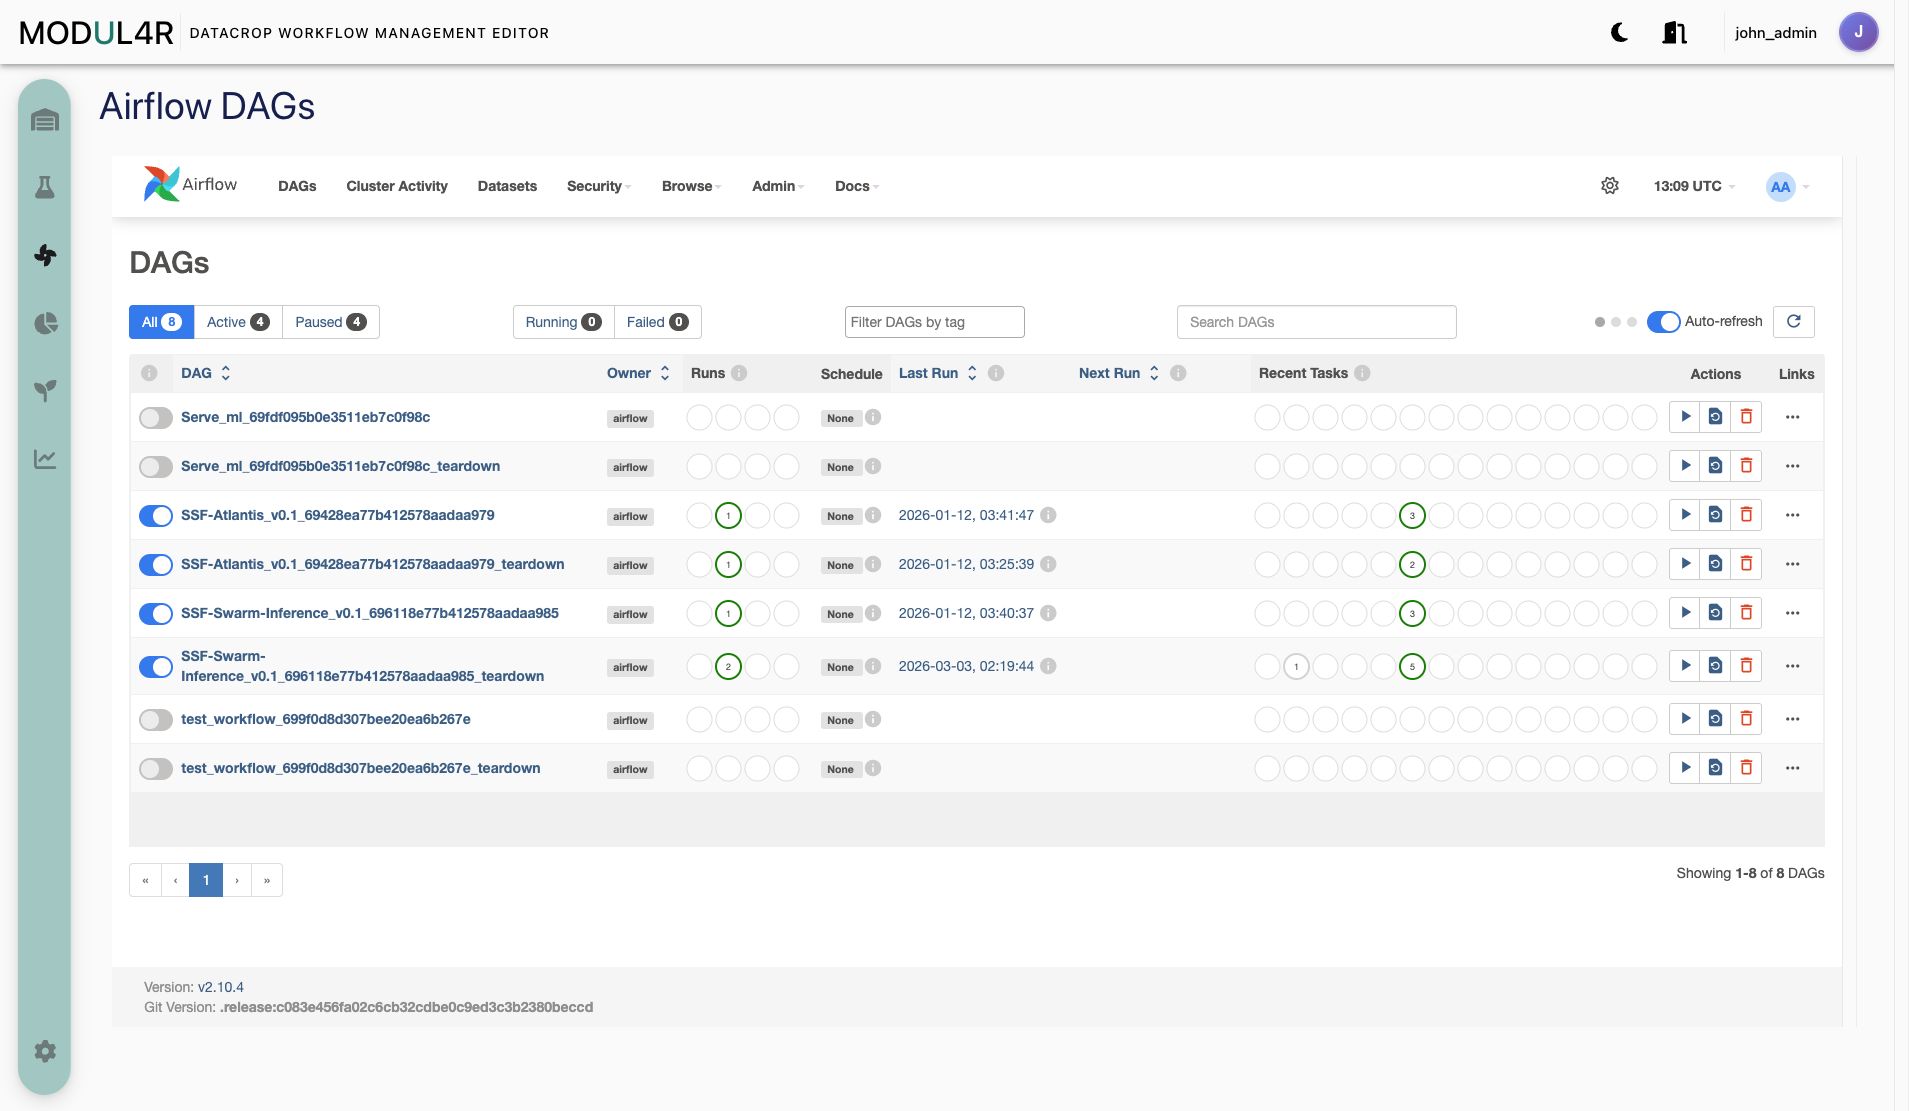
The editor exposes Airflow in two places:
- Sidebar Airflow DAGs page: opens the Airflow home UI in an iframe.
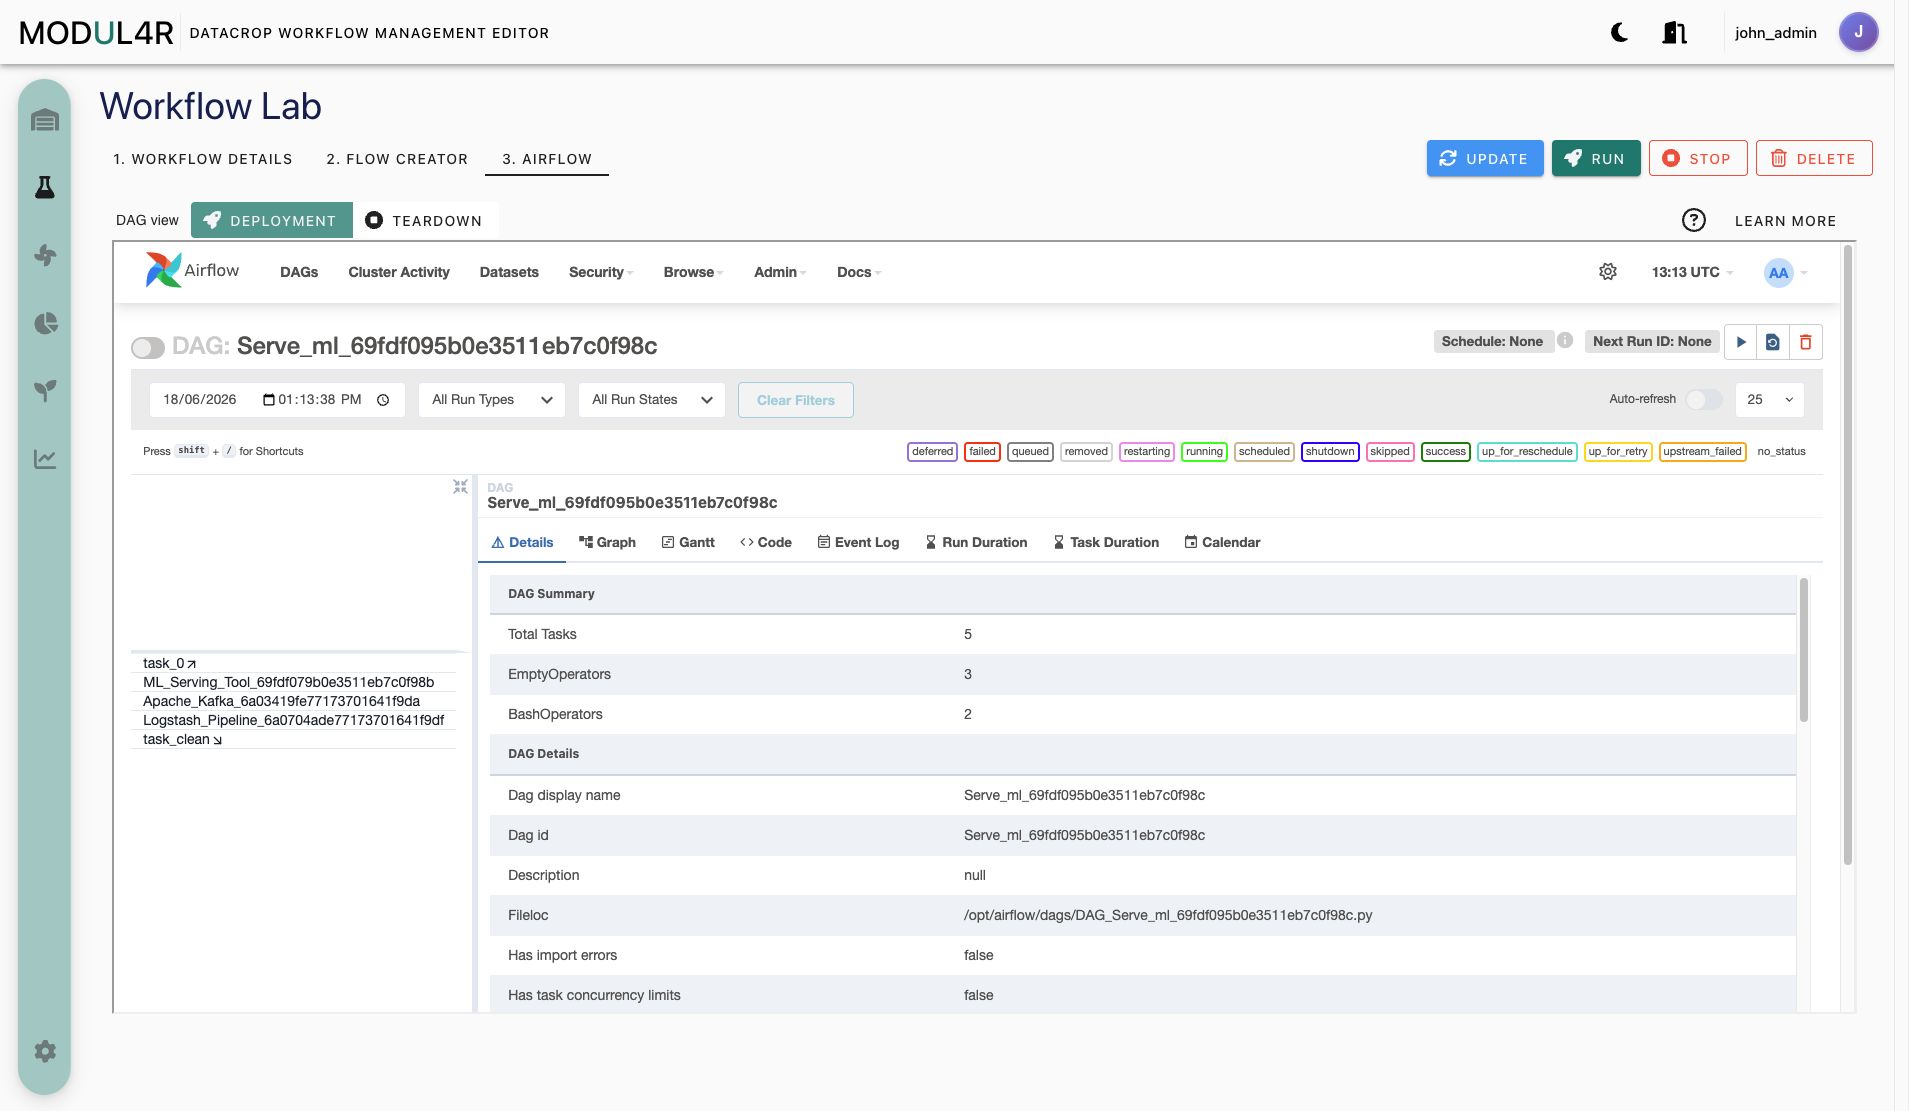
- Lab -> Airflow tab (for a selected workflow): embeds workflow-specific DAG grid views with a toggle between:
- Deployment
- Teardown
Workflow Runtime Actions
For saved workflows:
- Run triggers the deployment DAG.
- Stop triggers teardown DAG.
What To Expect
- Unsaved workflows cannot be inspected in the Lab Airflow tab.
- After save/update, workflow DAGs may take up to two minutes to appear and become runnable.
Kibana Visualizations
The Kibana Visualizations page combines a data catalog with a shortcut into Kibana. Use Open Kibana to go directly to the embedded Kibana UI, or use Visualize on a visualizable source to open the relevant source in Kibana.
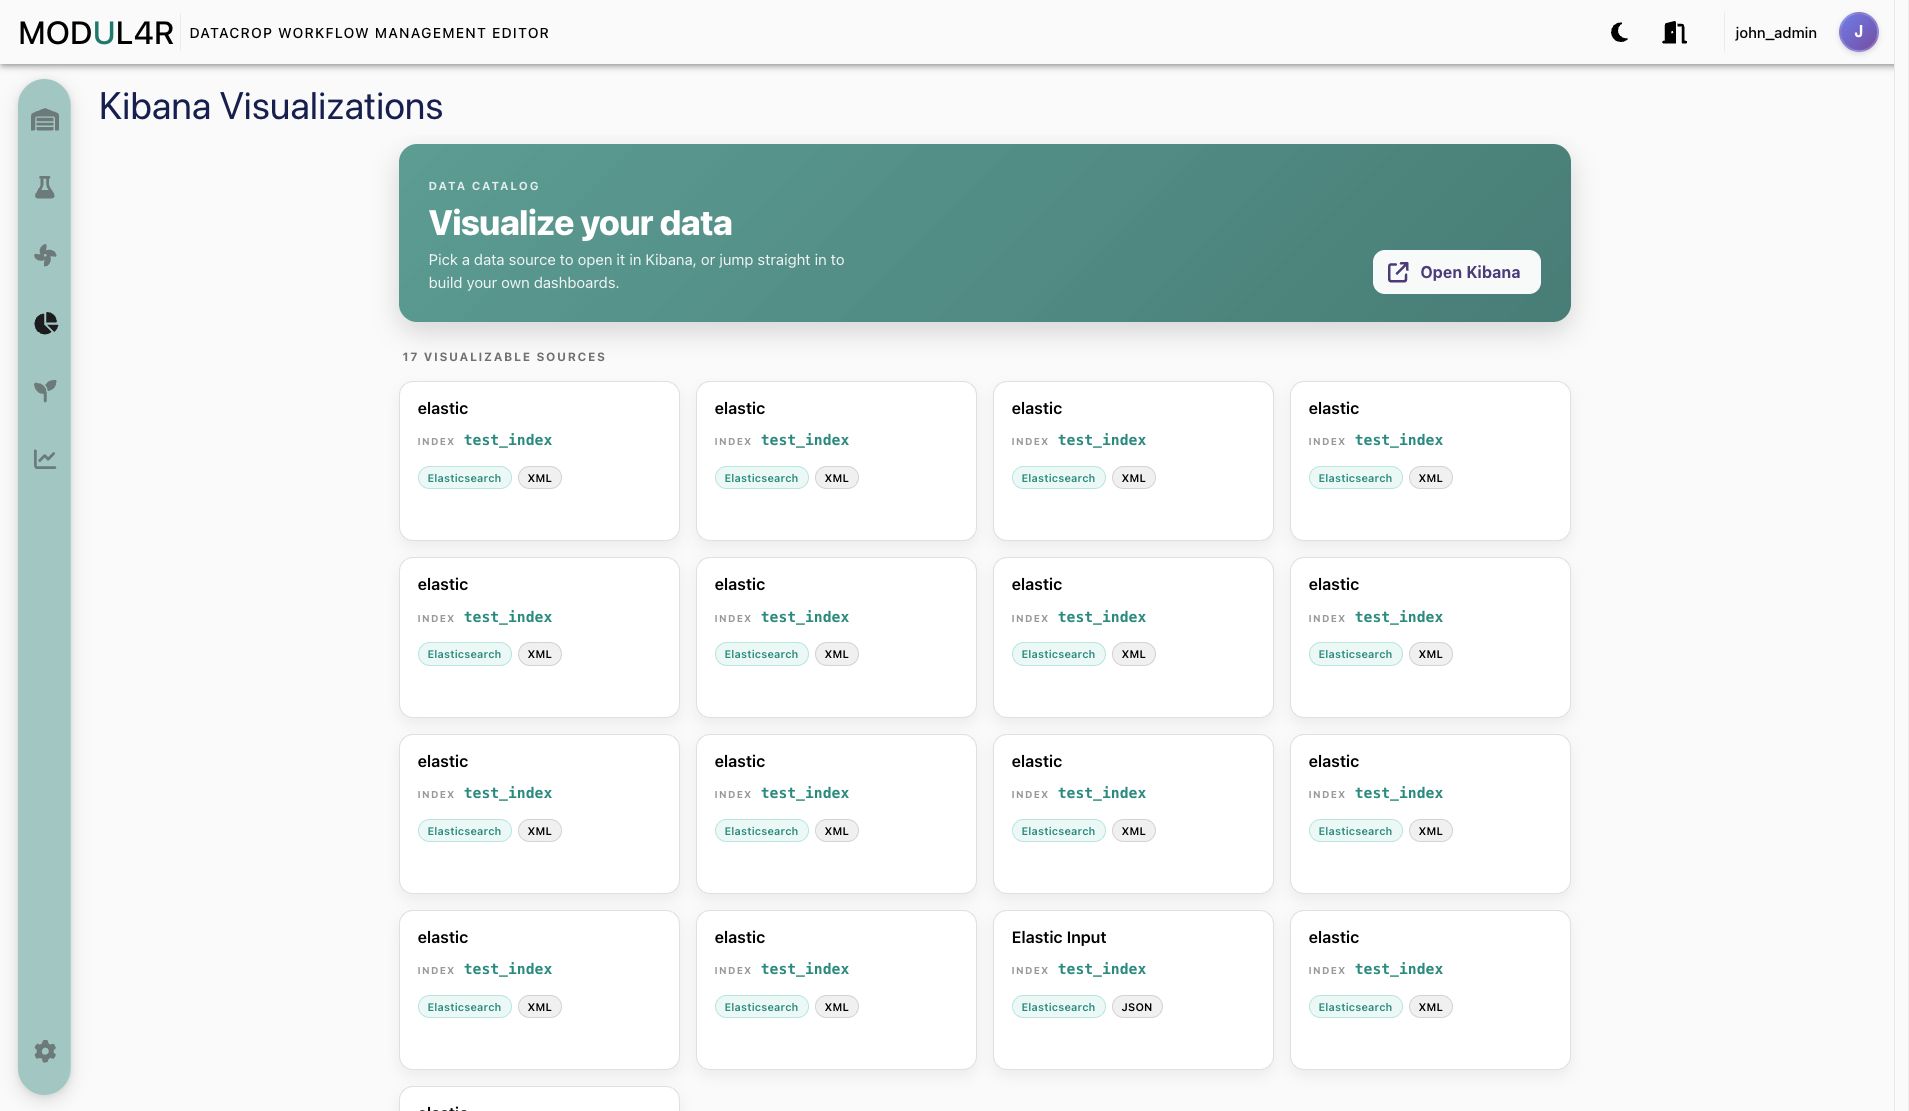
The catalog lists Digital Resources that can be visualized, including the resource name, backing index/source, interface type, and data kind where available.
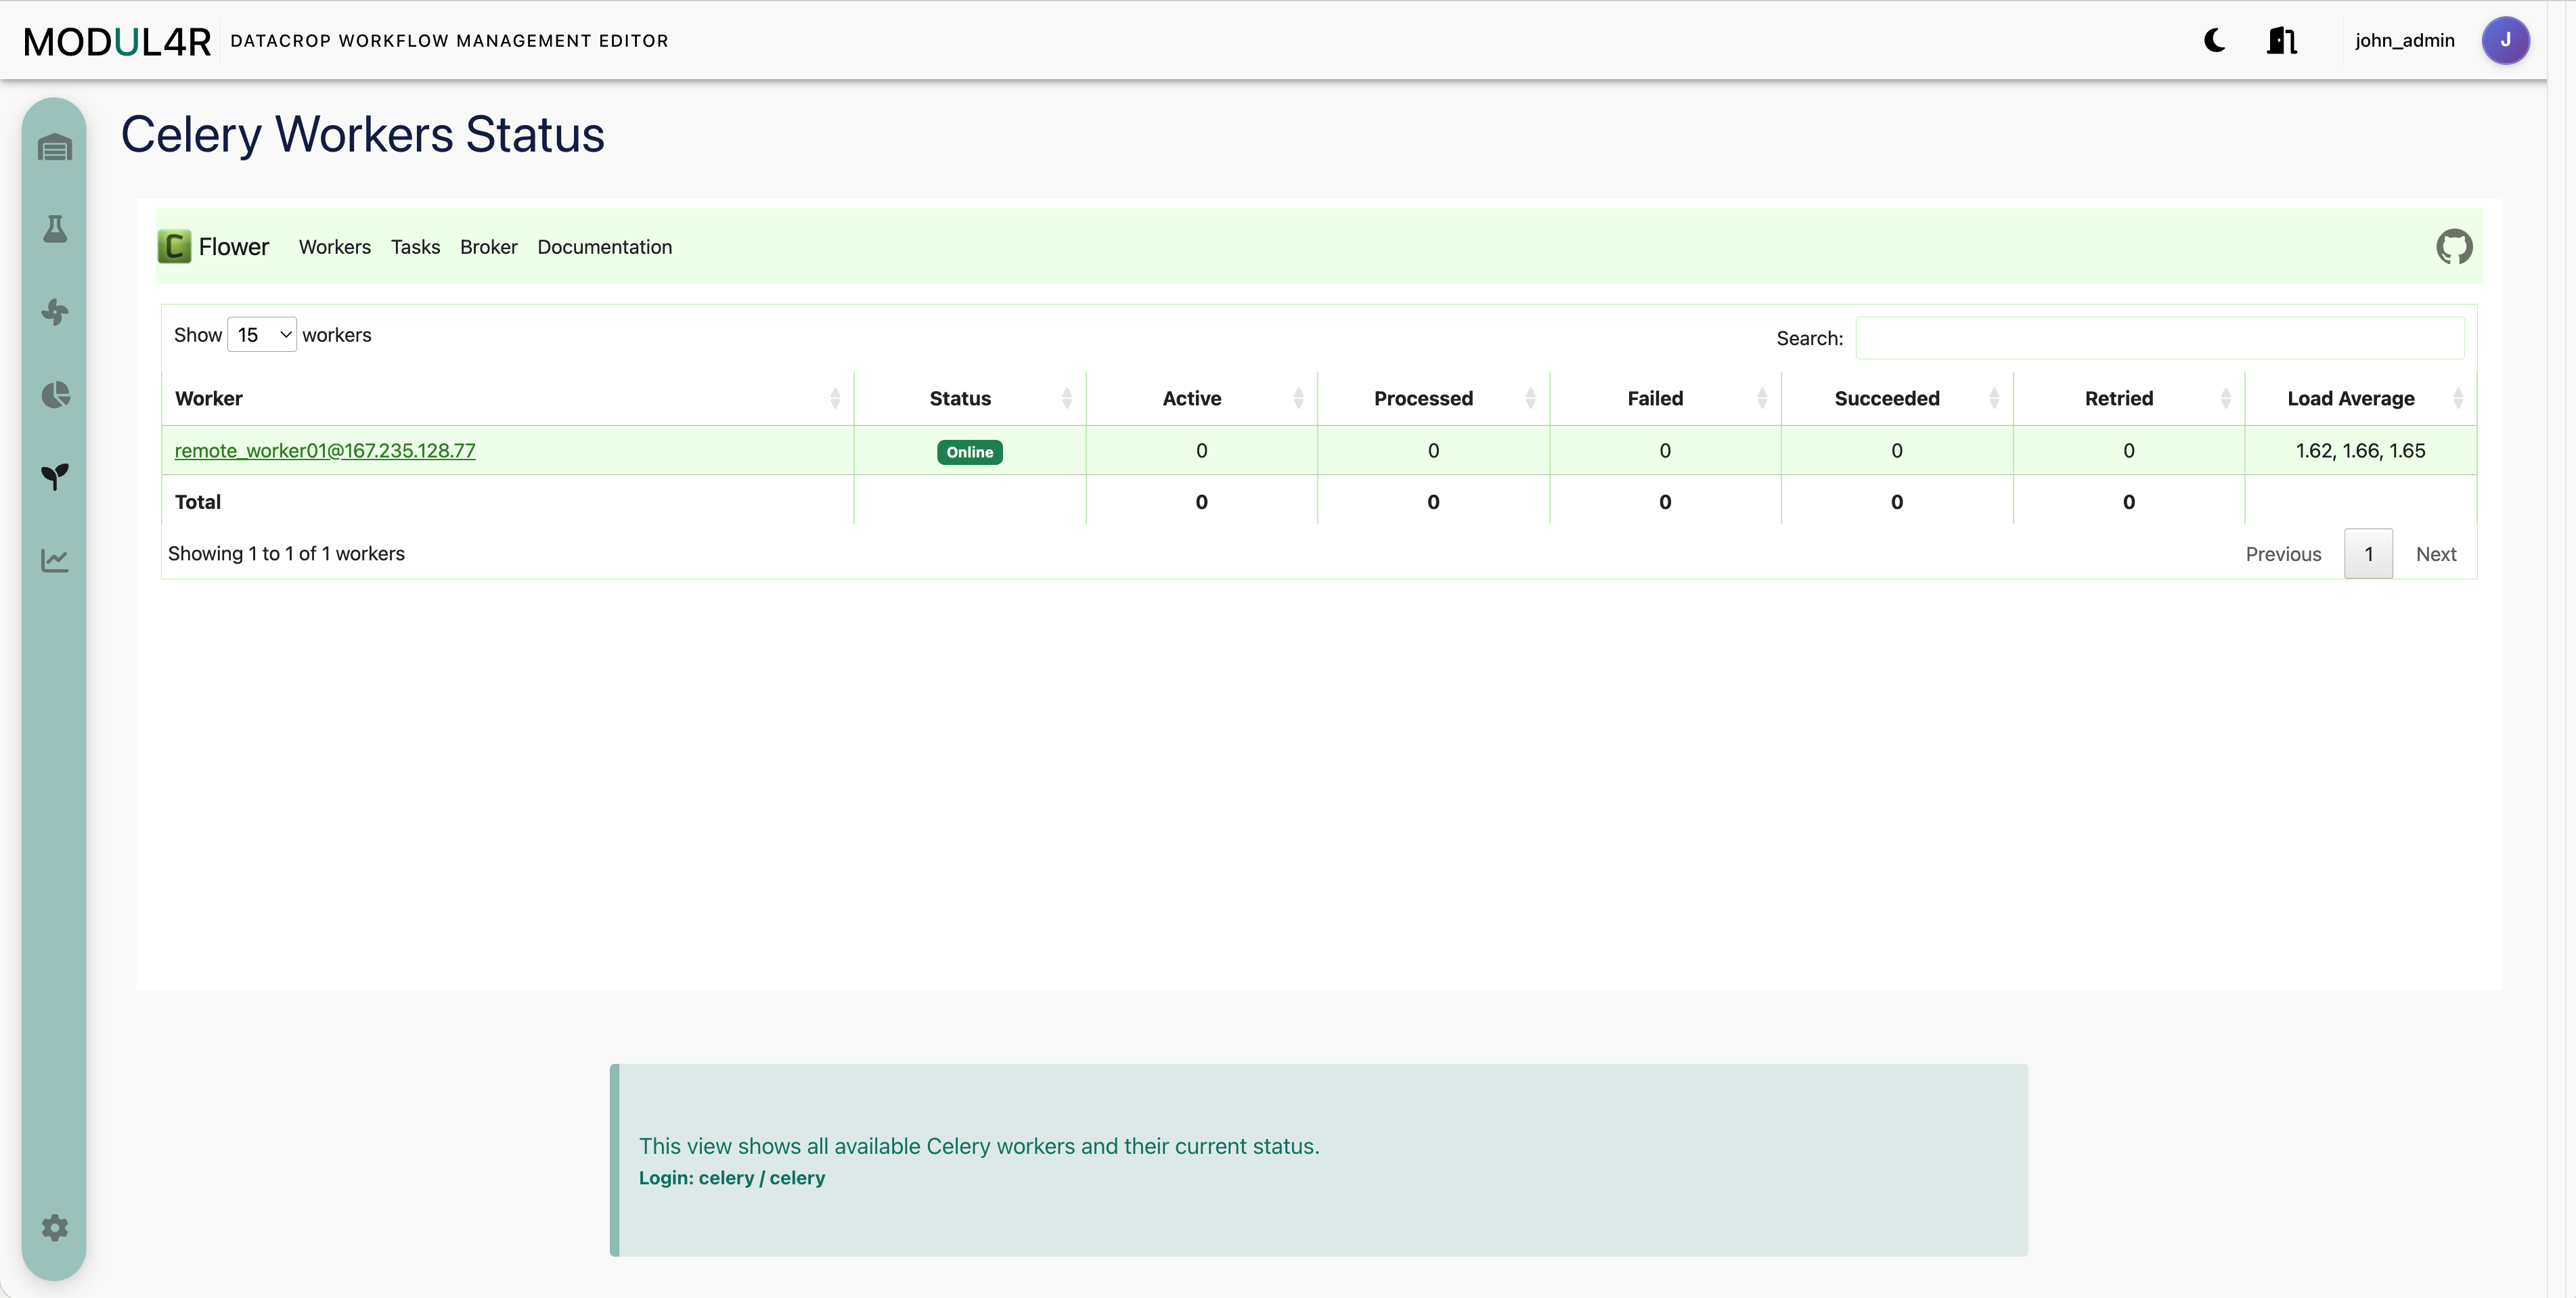
Celery Workers Status
The Celery Workers Status page embeds the worker status UI used to inspect Celery workers that execute workflow tasks. The page also shows the login hint exposed by the deployment (celery / celery) for the embedded worker-status interface.